Soultime · User-contributed screenshot · resized, content unchanged
Moods over a week, by dimension
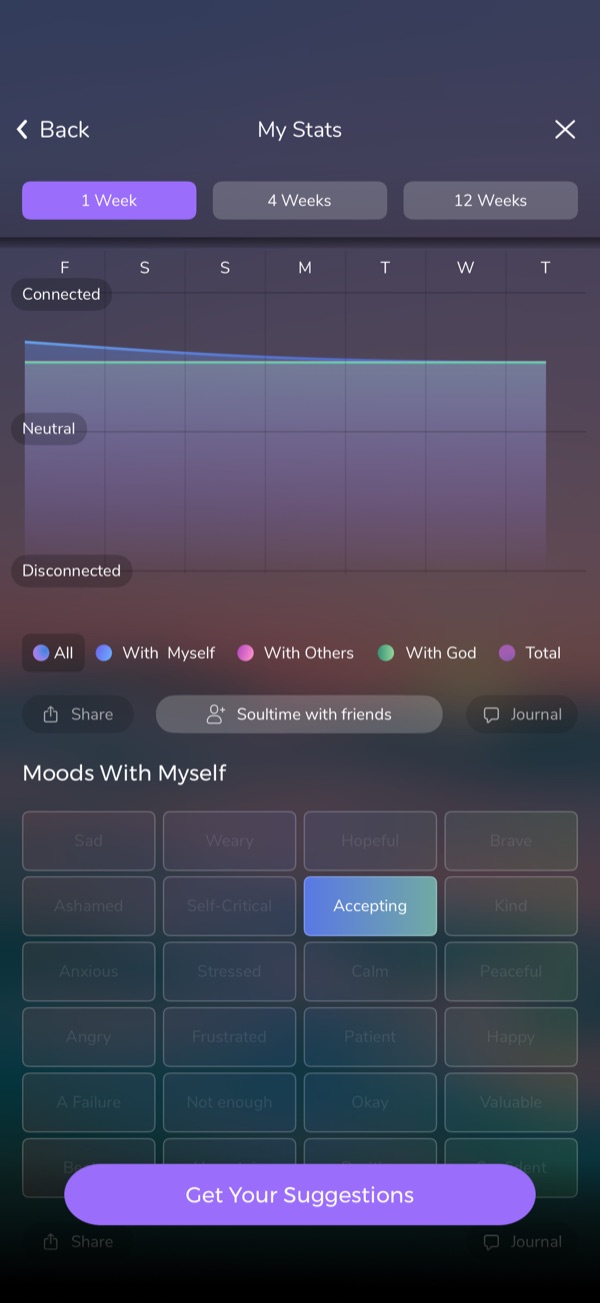
“My Stats” shows a line chart from Disconnected to Connected over a week, filters for All, With Myself, With Others, With God and Total, Share and “Soultime with friends” buttons, a grid of moods, and “Get Your Suggestions”.
Design takeaway
A chart turns feelings into a trend to watch. Consider whether a list in the person’s own words is enough, and make any sharing a deliberate act.
What this example establishes
“My Stats” shows a line chart from Disconnected to Connected over a week, filters for All, With Myself, With Others, With God and Total, Share and “Soultime with friends” buttons, a grid of moods, and “Get Your Suggestions”.
Limits and further verification
A still image shows one interface state. Gestures, timing, accessibility, persistence and what happens next were not tested. App version not recorded.
Provenance
- Platform
- iOS app · device model not recorded
- Image origin
- User-contributed screenshot · resized, content unchanged
- Source or capture date
- Captured 28 August 2025 · from embedded image metadata
- Reviewed
- 6 October 2026
- Version
- Not recorded
Screenshot captured by Tobias Treppmann for his app-pattern research and supplied for this design reference. Resized for the web; content unchanged. Interface, imagery and Scripture text remain the property of their respective rights holders.